Tutorial: Hulls and Watersheds
Before proceeding with the below examples, you may want to review about the concepts discussed in hulls and watersheds.
Below we work through a laughably minimal case study to demonstrate how the objects in the above linked document are utilized by canoPyHydro. This minimal tree, consisting of but a single trunk and a few branches, will henceforth be lovingly referred to as ‘charlie brown’.
The Basics
from matplotlib import pyplot as plt
import os
os.environ["CANOPYHYDRO_CONFIG"] = "./canopyhydro_config.toml"
from src.canopyhydro.CylinderCollection import CylinderCollection
charlieBrown = CylinderCollection()
charlieBrown.from_csv("minimal_tree.csv")

charlieBrown.draw("XY") # birds-eye view
charlieBrown.draw("XZ") # 'front' view
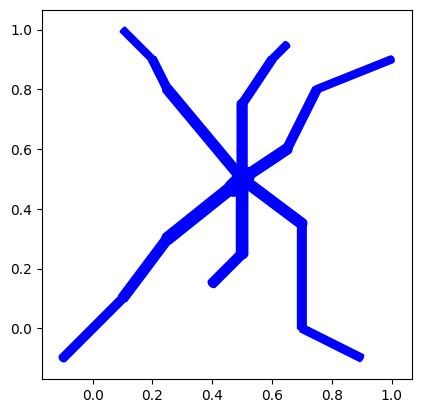

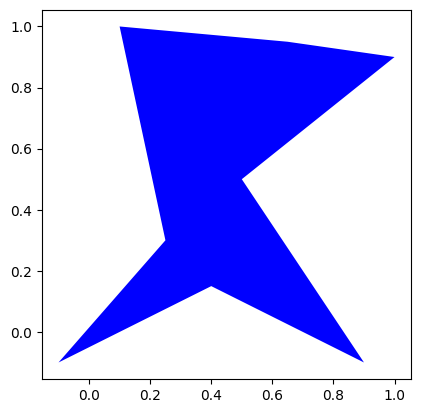
As you can see above, charlie has only a few, short branches. This is a use case engineered to be useful, but this is actually rather common, particularly in older trees, urban trees growing near structures and when a subset of branches (perhaps with a certain desired characteristic) is isolated for analysis. The feature of interest here will be the significant gaps between this tree’s (charlie brown’s) branches.
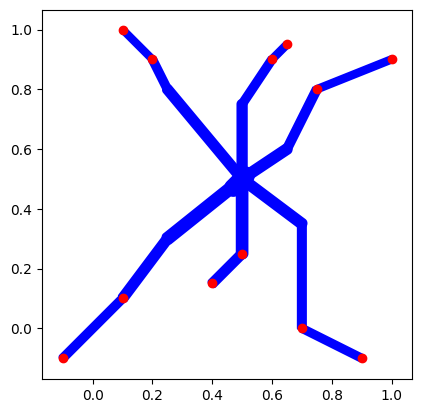
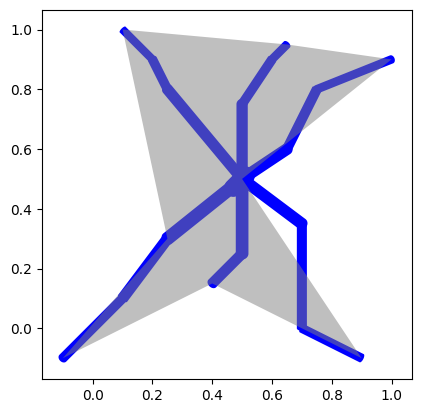
Now, I would like to know the canopy coverage area of charlieBrown’s branches, so I would like to draw the tree’s watershed boundary (our special case of an convex hull) as well as the above projections. As I care about total coverage, I will not pass any filters to the ‘watershed_boundary’ function. Thus the shape craated will be drawn with consideration of the start and end points of the cylinders on the tips of the tree’s branches. Purely for the sake of example, you can see these points plotted in red below.
import matplotlib.pyplot as plt
end_nodes = charlieBrown.get_end_nodes()

# Next we pull the x and y coordinates of these nodes
g = charlieBrown.graph
branch_tip_points = [(node.x, node.y) for node in charlieBrown.cylinders if node.cyl_id in end_nodes]

# finally, we plot charlie's XY projection alongside the branch tip points
charlieBrown.draw(plane = 'XY')
plt.scatter([x for x,_ in branch_tip_points], [y for _,y in branch_tip_points],c='red')
Now. to draw the watershed boundary around these points (with the default parameters) we simply call the ‘watershed boundary’ function. Optionally, we pass ‘draw=True’ to get a look at the shape generated.
full_hull, hull_components = charlieBrown.watershed_boundary(draw=True)
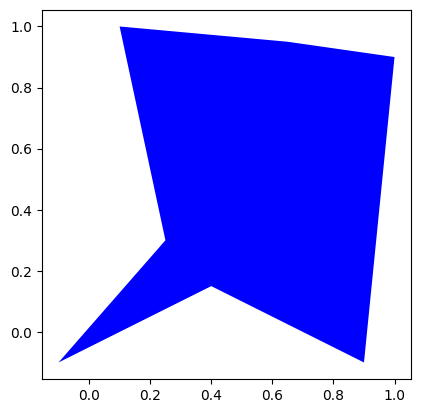
Notice that this function both saves the hull calculated to the charlieBrown object and returns the hull as an output. From the full_hull variablem we can then calculate the canopy coverage area of charlie’s branches:
full_hull.area
As a matter of fact, this hull is a shapely.Polygon object, so there are a variety of ways in which one can evaluate it and compare it to other hulls. See the shapely documentation for more info.
Creating Figures
Users also have the option to plot these shapes along side the branches of the tree its self by passing the ‘include_alpha_shape’ parameter to the ‘draw’ function. This parameter will cause a watershed boundary (our special case of an alpha shape) to be drawn ‘on top of’ the trees branches.
charlieBrown.draw("XY", include_alpha_shape=True, show=True)
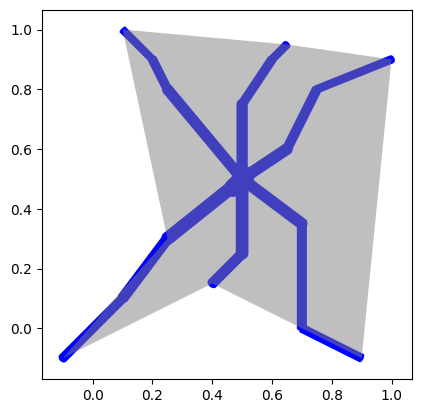
This latter method is not a directly customizable and, if no hull is created prior to calling the draw function, the afformentioned default hull will be drawn.
Note that the default concave hulls we’ve drawn to represent charlie’s watershed boundary enclose charlie’s branches more narrowly than the classically used circular/ovular shape. However the shapes do not fit very tightly given the default curvature/alpha factor (which determines the tightness of the fit) defaults to a somewhat small value of 1.8. If a tighter fitting boundary is desired, users can change these parameters.
# Calling 'watershed_boundary' always saves the created hull
#  to the cylinderCollection object.
charlieBrown.watershed_boundary(curvature_alpha=2.5,draw=True)

# The most recently created boundary can then be drawn
#   along side the tree using the '.draw' function
charlieBrown.draw(include_alpha_shape=True, show=True)
Now, you may notice that some fine tuning is needed, given a portion of the tree is outside of this now-rather-tightly-fitting convex hull. We leave the exercise of creating a tighter fitting - but still covering - convex hull as an exercise for the reader.